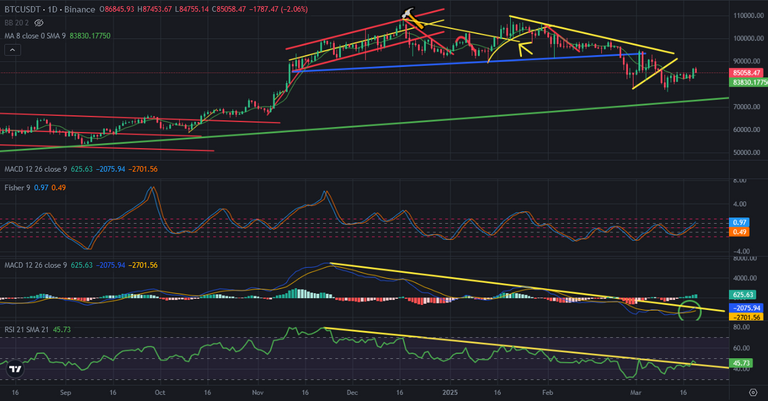
There was great resistances on major indicators. This was why Bitcoin price was under pressure. Finally, they are broken up today. Bitcoin broke up the resistances on major indicators. So, it is time to see price reversing up.
Here you can see daily chart of Bitcoin. I drew downtrend lines on majors indicators. MACD and Fisher Indicators broke up downtrend lines seems great resistances. I can be sure that we will see good days. I shared lots of analysis about this resistance. Finally they are broken. I said I was waiting to see start of bullish trend until end of March or the beginning of April. It is done. Hidden start happened. Even we don't see price pump on Bitcoin price chart, bullish trend started hiddenly..
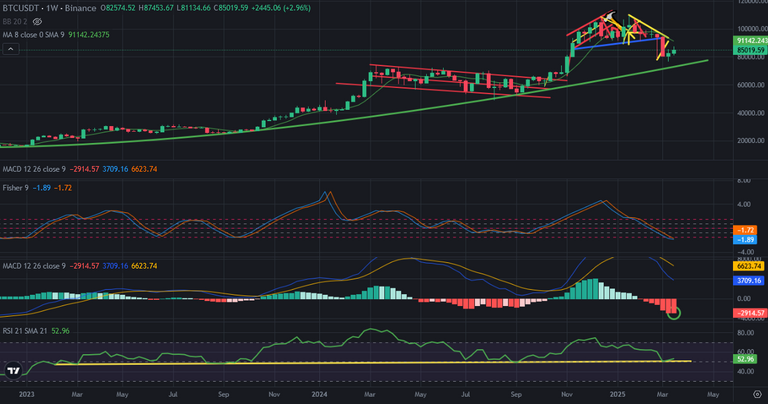
Here you can see weekly chart of Bitcoin. There is great support line on RSI Indicator. It supported. It is time to see uptrend on weekly chart of Bitcoin. Fisher Indicators is on the bottom and ready to reverse. We will see green candles in a few weeks and It will reverse up. MACD Indicator is trying to complete correction. We may see reversing on MACD Indicator..
So, weekly chart of Bitcoin will turns as bullish. Daily chart of Bitcoin price entered bullish season. We will see it on weekly chart of Bitcoin in a few weeks.
So, good days are coming. As I said, we will enter bullish trend in a few weeks.
We will see..
Posted Using INLEO