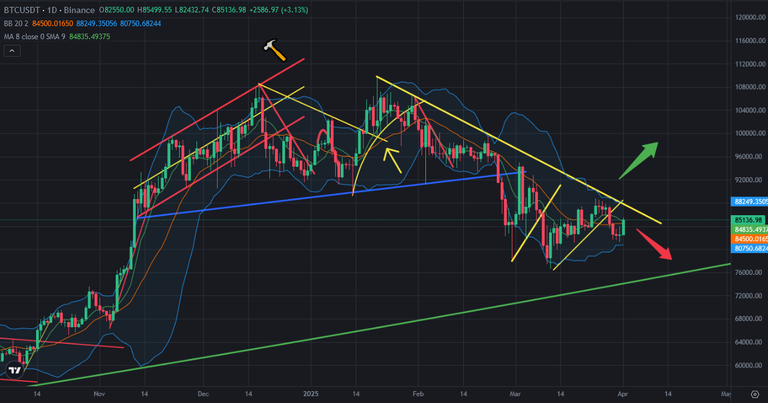
There was great resistance on Bitcoin price chart coming from 108K USD. It is tested 4 times before. Bitcoin price broke down mini uptrend line in a few days ago. Bitcoin price supported by the bottom line of Bollinger Bands.
Here you can see daily chart of Bitcoin. After supporting by the bottom line of Bollinger Bands, Bitcoin price went up to break up the middle line of Bollinger Bands. Today, Bitcoin price broke up the middle line of Bollinger Bands in daily chart. The top line is the first target of Bitcoin price..
The top line of Bollinger Bands is at same level as great resistance. So, This is why we say that it is great resistance..
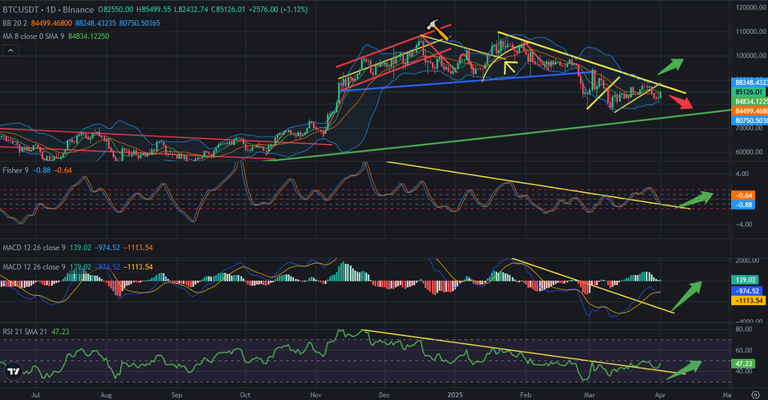
Here you can see the indicators on daily chart of Bitcoin. Fisher Indicator is trying to reverse up. MACD Indicator is trying to go up. These are good signal for bullish trend. If MACD Indicator goes up wtihout reversing down, Bitcoin price may break up great resistance in this month.
All of major indicator broke up great resistances. We only wait for price breaking up..
I shared a few analysis about Bitcoin price chart and said I was waiting for bullish trend until the beginning of April. I came. I hope we will see good days on crypto market.
We will see..