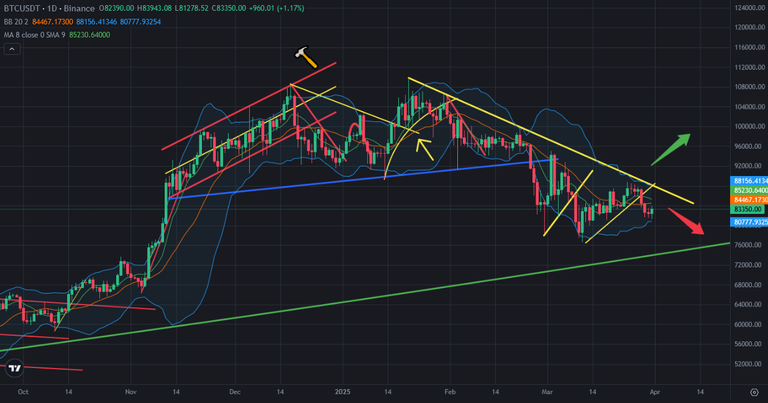
Even Bitcoin price broke down mini uptrend line, we have not seen huge price drop. After closing the week, Bitcoin price got green daily candle. This is the last day of the month. I shared lots of analysis and said I was waiting for bullish trend until the beginning of April. We should have good start of Bitcoin price chart in April.
Here you can see daily chart of Bitcoin. Bitcoin price is under pressure of downtrend line coming from 108K. Bitcoin may break up this downtrend line in April. Ethereum has 3/3 monthly red candles in this year. I think April will be good for crypto market.
The bottom line of Bollinger Bands stopped the price drop on Bitcoin chart. It will support Bitcoin price in next days.
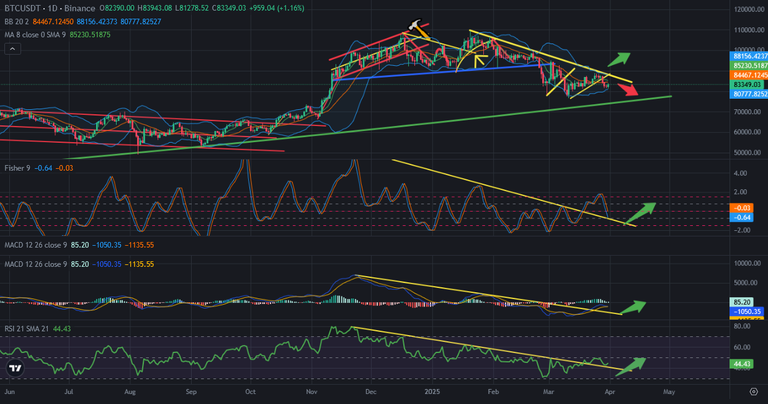
Here you can see the indicators on daily chart of Bitcoin. All of indicators broke up downtrend lines. This is why I still say that I am waiting for price pump on Bitcoin price chart in April.
Market maker always do that sell in May go away. We may not see same scenario in this year. I have good hopes about April.
Even Bitcoin price closed the last week close to lowest level of the week, It started the new week with good move. I think that the next days may follow this move.
We will see..